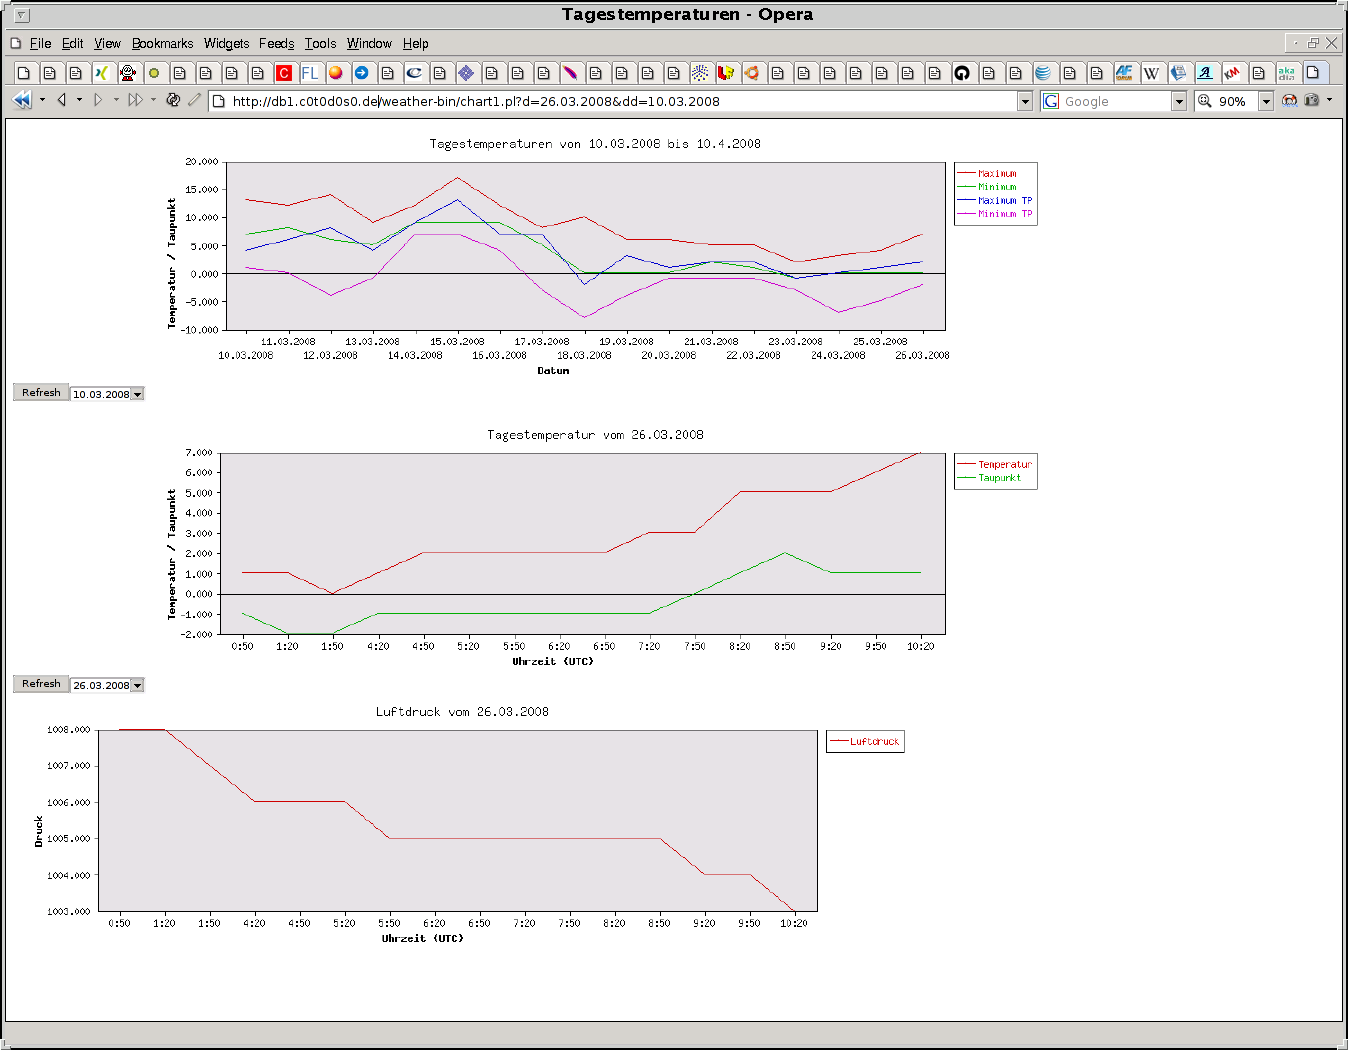
Hi,

Chris Kottaridis <chriskot@xxxxxxxxxxxxx> writes:

> I've got some commodities data stored in a local mysql database. I've
> been using command line perl scripts to access the data. I'd like to
> throw some typical charting of high/open/low/close charts.
I like to use Perls Chart module. It is very easy to combine it with the
DBI and the CGI module. The simplest result reachable with a few lines
of code may look like [1]. If you like to experiment with your data,
toss it around and if your try to figure out how parts of the data are
related the Chart module is a little bit unhandy. Better use R or
another system in that case.

Michael


[1] http://www.c0t0d0s0.de/tmp/w.png

--
biff4emacsen - A biff-like tool for (X)Emacs
http://www.c0t0d0s0.de/biff4emacsen/biff4emacsen.html
Flood - Your friendly network packet generator
http://www.c0t0d0s0.de/flood/flood.html

--
fedora-list mailing list
fedora-list@xxxxxxxxxx
To unsubscribe: https://www.redhat.com/mailman/listinfo/fedora-list
Guidelines: http://fedoraproject.org/wiki/Communicate/MailingListGuidelines
